Why the Internet Hates Us
Google gets an incredibly wide variety of searches each day. With 5.6 billion searches, it would be interesting to see what exactly gets searched.
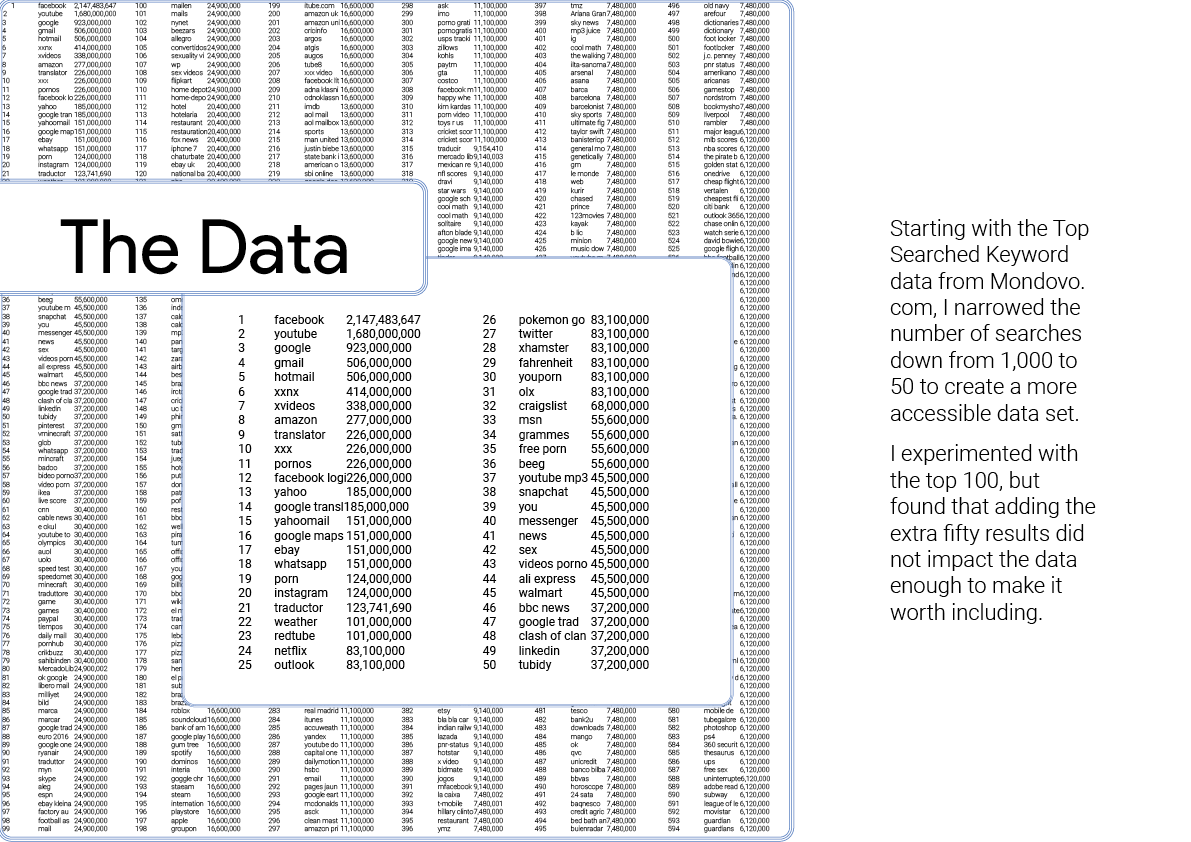
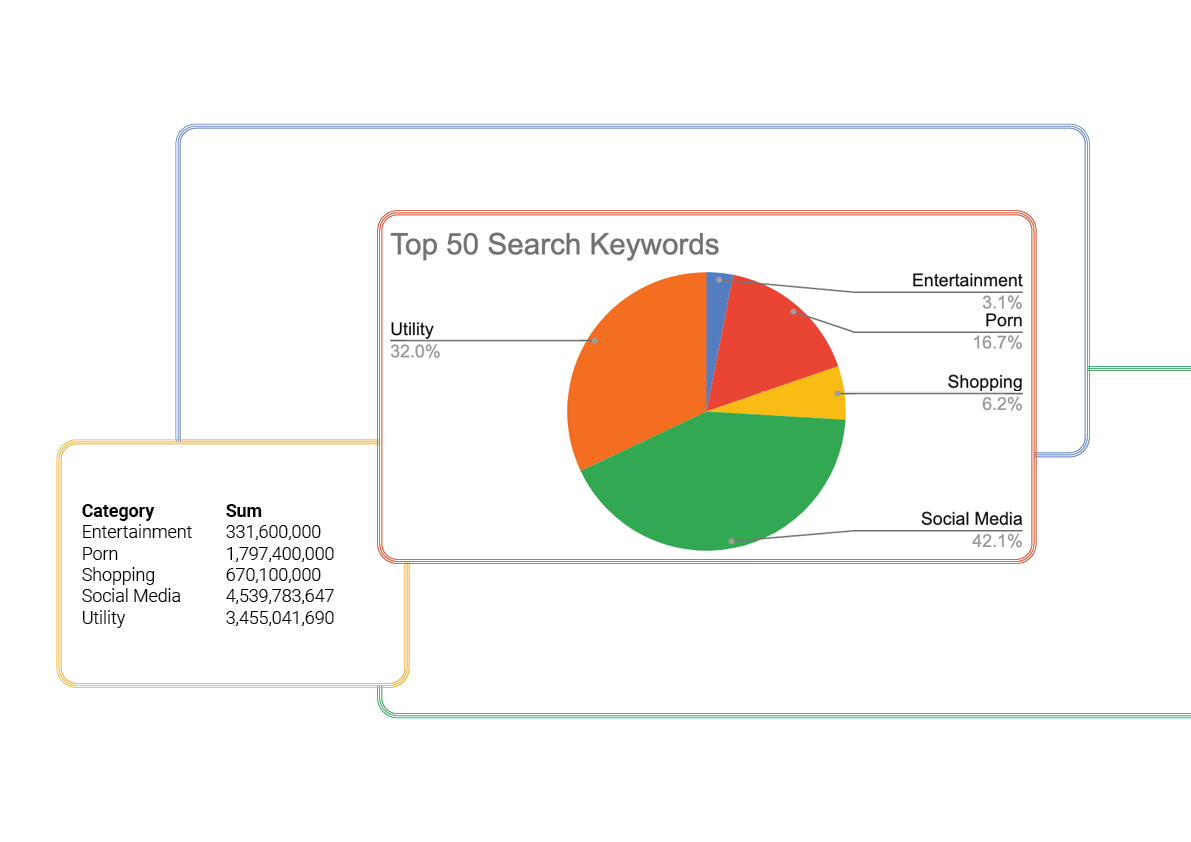
This data visualization aims to show what is searched. Using data from Mondovo.com, the top 1,000 keywords were narrowed down to 50. These words were then compiled into five groupings where the number of searches were summed together. The categories consist of social media, porn, shopping, utility, and entertainment. Within “utility” is Google, which is a piece of interest considering the fact that people are Googling “Google” itself. This is why, while it is a single keyword, Google is displayed on its own.
The chosen categories that are featured are constructed using string segments between nails that represent each search. Each segment of string represents 1,000,000 searches, so the distribution is as follows:
Social Media has 4,539,783,647 searches, equaling 4,540 segments.
Porn has 1,797,400,000 searches, equaling 1,797 segments.
Google has 923,000,000 searches, equaling 923 segments.
Shopping has 670,100,000 searches, equaling 670 segments.
Altogether, there were 7,930 segments of string distributed by the category and number of nails in each letter. For each word, the corresponding number of segments is divided by the number of nails per category and distributed accordingly. From there, it is connected to the search bar to tie the whole piece together.


